.svg)
Every planner has heard them: the rules of thumb passed down through generations of builders. “Never pour concrete in January.” “Don’t schedule roofing in July.” “Plan to lose 10 days every November.” These rules feel like common sense, and in some cases, they are. But in many others, they are oversimplifications that either waste valuable schedule time or expose projects to unexpected risk.
The reality is that seasonal construction downtime is complex. It varies by location, activity type, and even year to year. Some “truths” are actually myths that don’t stand up against hard data. In an era where projects face tighter margins and increased climate uncertainty, relying on old assumptions isn’t just inefficient — it’s risky.
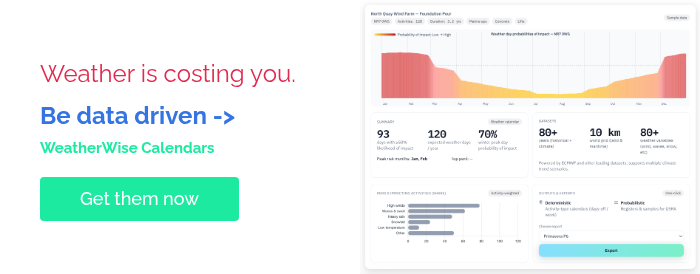
By separating fact from fiction, and by using modern tools like construction weather platforms, planners can build more accurate schedules, strengthen weather risk management, and improve both weather resilience and climate resilience.
Common Myths About Seasonal Downtime
Myth 1: “January is Always a Lost Month”
While January is certainly challenging in colder regions, it’s far from universally lost. In southern Europe, much of the southern US, and coastal regions of the UK, January can offer workable windows for certain tasks. Writing off the entire month may add unnecessary delay.
Myth 2: “Summer Means Smooth Sailing”
Hot weather brings its own risks. Concrete hydration issues, worker health and safety concerns, and material performance problems can all cause downtime. In fact, some regions report more downtime in peak summer due to heatwaves than in shoulder seasons like spring or autumn.
Myth 3: “Rain Days Can Be Planned as Fixed Buffers”
Rainfall is highly variable. Some years bring twice the expected rainfall in key months; others bring half. Adding a “standard 5 rain days per month” might cover one year but fall short the next. Without probability-based planning, these buffers are little more than educated guesses.
Myth 4: “All Activities Are Equally Impacted”
Seasonal calendars often treat downtime as universal. But excavation may continue in light rain, while roofing must pause. Concrete pours may fail in cold conditions, while steel erection may be halted by wind. Treating downtime as one-size-fits-all ignores these differences.
The Cost of Relying on Myths
Believing in seasonal downtime myths can harm projects in two key ways:
-
Overestimation
Writing off entire months or adding too many buffer days inflates schedules and reduces competitiveness in bidding. Projects look longer and costlier than they need to be. -
Underestimation
Assuming summer months are risk-free or that a handful of rain days will cover disruptions can lead to cascading delays, overtime costs, and disputes.
Both outcomes reduce trust between contractors, clients, and stakeholders — and erode margins.
Fact: Seasonal Downtime is Highly Variable
When examined with actual climate and productivity data, seasonal downtime reveals patterns that defy oversimplification.
-
Regional differences:
-
London averages 13 rain days in October, but Dallas averages just 8.
-
Oslo may lose 20+ freeze days in January, while Madrid loses none.
-
-
Year-to-year variability:
One winter may be mild, with only 5 true downtime days. The next may bring extreme cold and snow, with 20 or more lost days. -
Activity-specific impacts:
A month “lost” for concrete pours may still be productive for interior work or earthmoving.
This variability highlights the importance of moving from assumption-based calendars to data-driven downtime planning.
How to Separate Fact from Fiction
1. Use Local Climate Data
Pull data from reliable sources like NOAA, the Met Office, or Environment Canada. Look at long-term patterns (10–20 years) as well as extremes.
2. Define Thresholds Per Activity
For example:
-
Concrete → below 5°C or above 32°C.
-
Cranes → wind speeds above 35 mph.
-
Roofing → rain >5mm/day.
This ensures your downtime reflects real operational limits.
3. Apply Probability, Not Averages
Instead of saying “assume 10 downtime days,” model ranges and probabilities. For example: “In March, there’s a 60% chance of losing 3–5 days to rain.” This supports weather risk management that reflects uncertainty rather than ignoring it.
4. Use a Construction Weather Platform
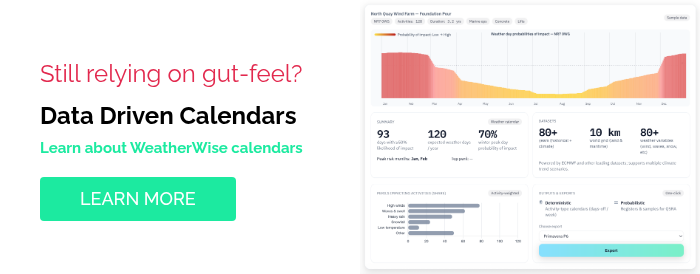
Tools like WeatherWise automate the process by integrating decades of climate data, activity-specific thresholds, and probabilistic modeling. They generate seasonal downtime calendars with daily precision, which can be imported directly into Primavera P6, MS Project, or BIM systems.
5. Update for Climate Resilience
Historic norms are shifting. Winters are bringing unexpected thaws, summers are seeing record-breaking heatwaves, and rainfall is becoming more intense. Incorporating climate models into downtime planning builds climate resilience into schedules.
Example: Spring Downtime — Myth vs. Reality
Imagine two planners working on projects scheduled to start in April:
-
Planner A (New York): Uses the myth that spring is “safe.” They allocate minimal downtime. But April sees record rainfall, resulting in 12 lost days. The schedule slips and costs balloon.
-
Planner B (Paris): Uses a construction weather platform to analyze 20 years of April data. The model predicts a 40% chance of 5–8 lost days. The downtime calendar accounts for this range. When 7 days are lost, the schedule absorbs the impact smoothly.
This shows the power of replacing fiction with fact-based planning.
The Broader Benefits
Separating fact from fiction in seasonal downtime planning provides benefits beyond schedule accuracy:
-
Stronger bids — contractors who present data-backed calendars appear more professional and trustworthy.
-
Reduced disputes — factual evidence of downtime probabilities reduces claims and disagreements.
-
Optimized resources — labor, equipment, and materials are better aligned with realistic working windows.
-
Demonstrated resilience — clients, insurers, and financiers increasingly expect contractors to show proactive weather resilience and climate resilience.
Final Thoughts
Seasonal construction downtime is real — but the way it’s planned often isn’t. Myths and oversimplifications lead to costly inefficiencies and risks. By moving to a data-driven approach, planners can replace guesswork with precision, strengthening schedules and improving outcomes.
In today’s climate, where uncertainty is the only constant, construction weather platforms give planners the tools they need to separate fact from fiction. By embracing weather risk management, and by embedding resilience into every schedule, the industry can finally bring clarity to one of its oldest challenges.